Year 11 Maths - General
Investigating Relationships Between Two Numerical Variables
Scatterplots and Their Construction
ACCOUNT REQUIRED
Unlock all 5 questions & worked solutions
You're viewing a free preview. Create an account to access the complete question set, step-by-step solutions, and progress tracking.
All Questions
Access the full question set for every topic.
Worked Solutions
Step-by-step explanations for every answer.
Track Progress
Mark questions right or wrong and monitor your growth.
It's Free
No credit card required - sign up in under a minute.
Questions
Question 1
30377
The scatter plot shows the percentage of unemployed adults and the number of major thefts per day. How many thefts occurred when there was 10% unemployment?
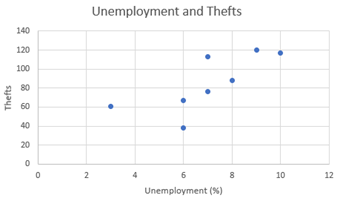
Approx 121
Approx 117
Approx 108
Approx 84
📚 Want More Questions?
There are 4 more questions available. Create your free account to access the complete question set with detailed solutions.