Year 11 (2026) Maths Standard (2026)
Data Analysis 1
Frequency And Cumulative Frequency Graphs
ACCOUNT REQUIRED
Unlock all 7 questions & worked solutions
You're viewing a free preview. Create an account to access the complete question set, step-by-step solutions, and progress tracking.
All Questions
Access the full question set for every topic.
Worked Solutions
Step-by-step explanations for every answer.
Track Progress
Mark questions right or wrong and monitor your growth.
It's Free
No credit card required - sign up in under a minute.
Questions
Question 1
15487
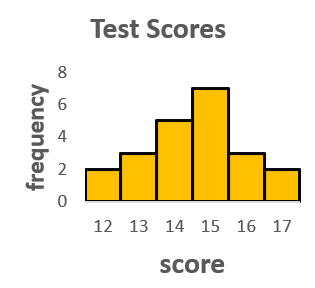
The adjacent histogram represents scores for a test given to a group of students.
a) The number of students in the group is?
b) Determine the score with the highest frequency.
c) Calculate the percentage of scores greater than 15.

📚 Want More Questions?
There are 6 more questions available. Create your free account to access the complete question set with detailed solutions.