Parallel Boxplots
Unlock all 7 questions & worked solutions
You're viewing a free preview. Create an account to access the complete question set, step-by-step solutions, and progress tracking.
All Questions
Access the full question set for every topic.
Worked Solutions
Step-by-step explanations for every answer.
Track Progress
Mark questions right or wrong and monitor your growth.
It's Free
No credit card required - sign up in under a minute.
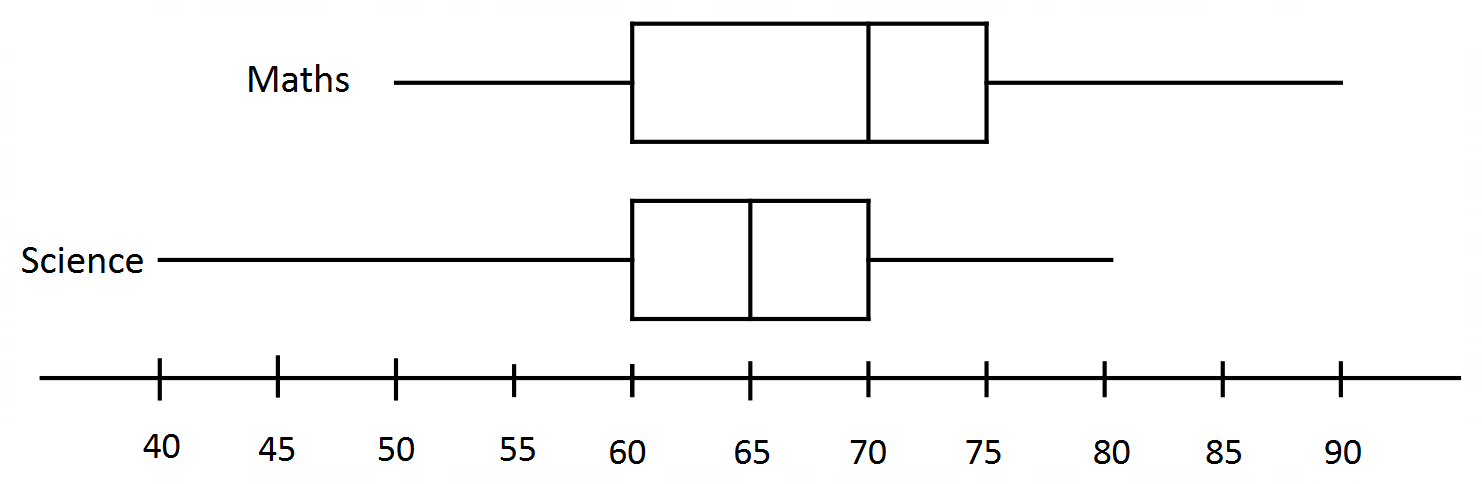
The boxplots for a maths and science test are given.
i) What is the difference in their ranges?
ii) What is the difference in their IQRs?
iii) What is the difference in their medians?
iv) If there were \(20\) students who sat for both tests, how many students scored \(70\) or more in maths and science respectively?
v) What are the outliers for for maths and science respectively?

📚 Want More Questions?
There are 6 more questions available. Create your free account to access the complete question set with detailed solutions.