Comparing Data Sets
Unlock all 8 questions & worked solutions
You're viewing a free preview. Create an account to access the complete question set, step-by-step solutions, and progress tracking.
All Questions
Access the full question set for every topic.
Worked Solutions
Step-by-step explanations for every answer.
Track Progress
Mark questions right or wrong and monitor your growth.
It's Free
No credit card required - sign up in under a minute.
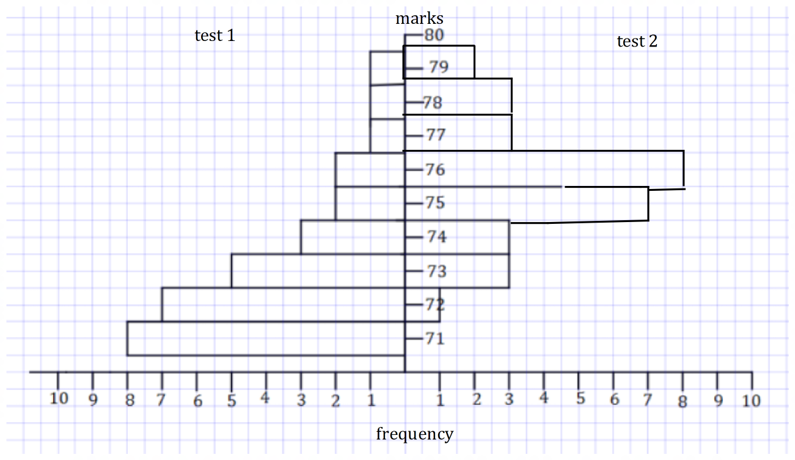
A teacher conducted two tests of mathematics in a class the result are shown in the following graph.
a) How many students are there in the class?
b) What is the mean of marks of test 1?
c) Describe the distribution of test 1
d) Describe the distribution of test 2

📚 Want More Questions?
There are 7 more questions available. Create your free account to access the complete question set with detailed solutions.