Resources for Displaying Data 1
-
Questions
10
With Worked SolutionClick Here -
Video Tutorials
2
Click Here -
HSC Questions
2
With Worked SolutionClick Here
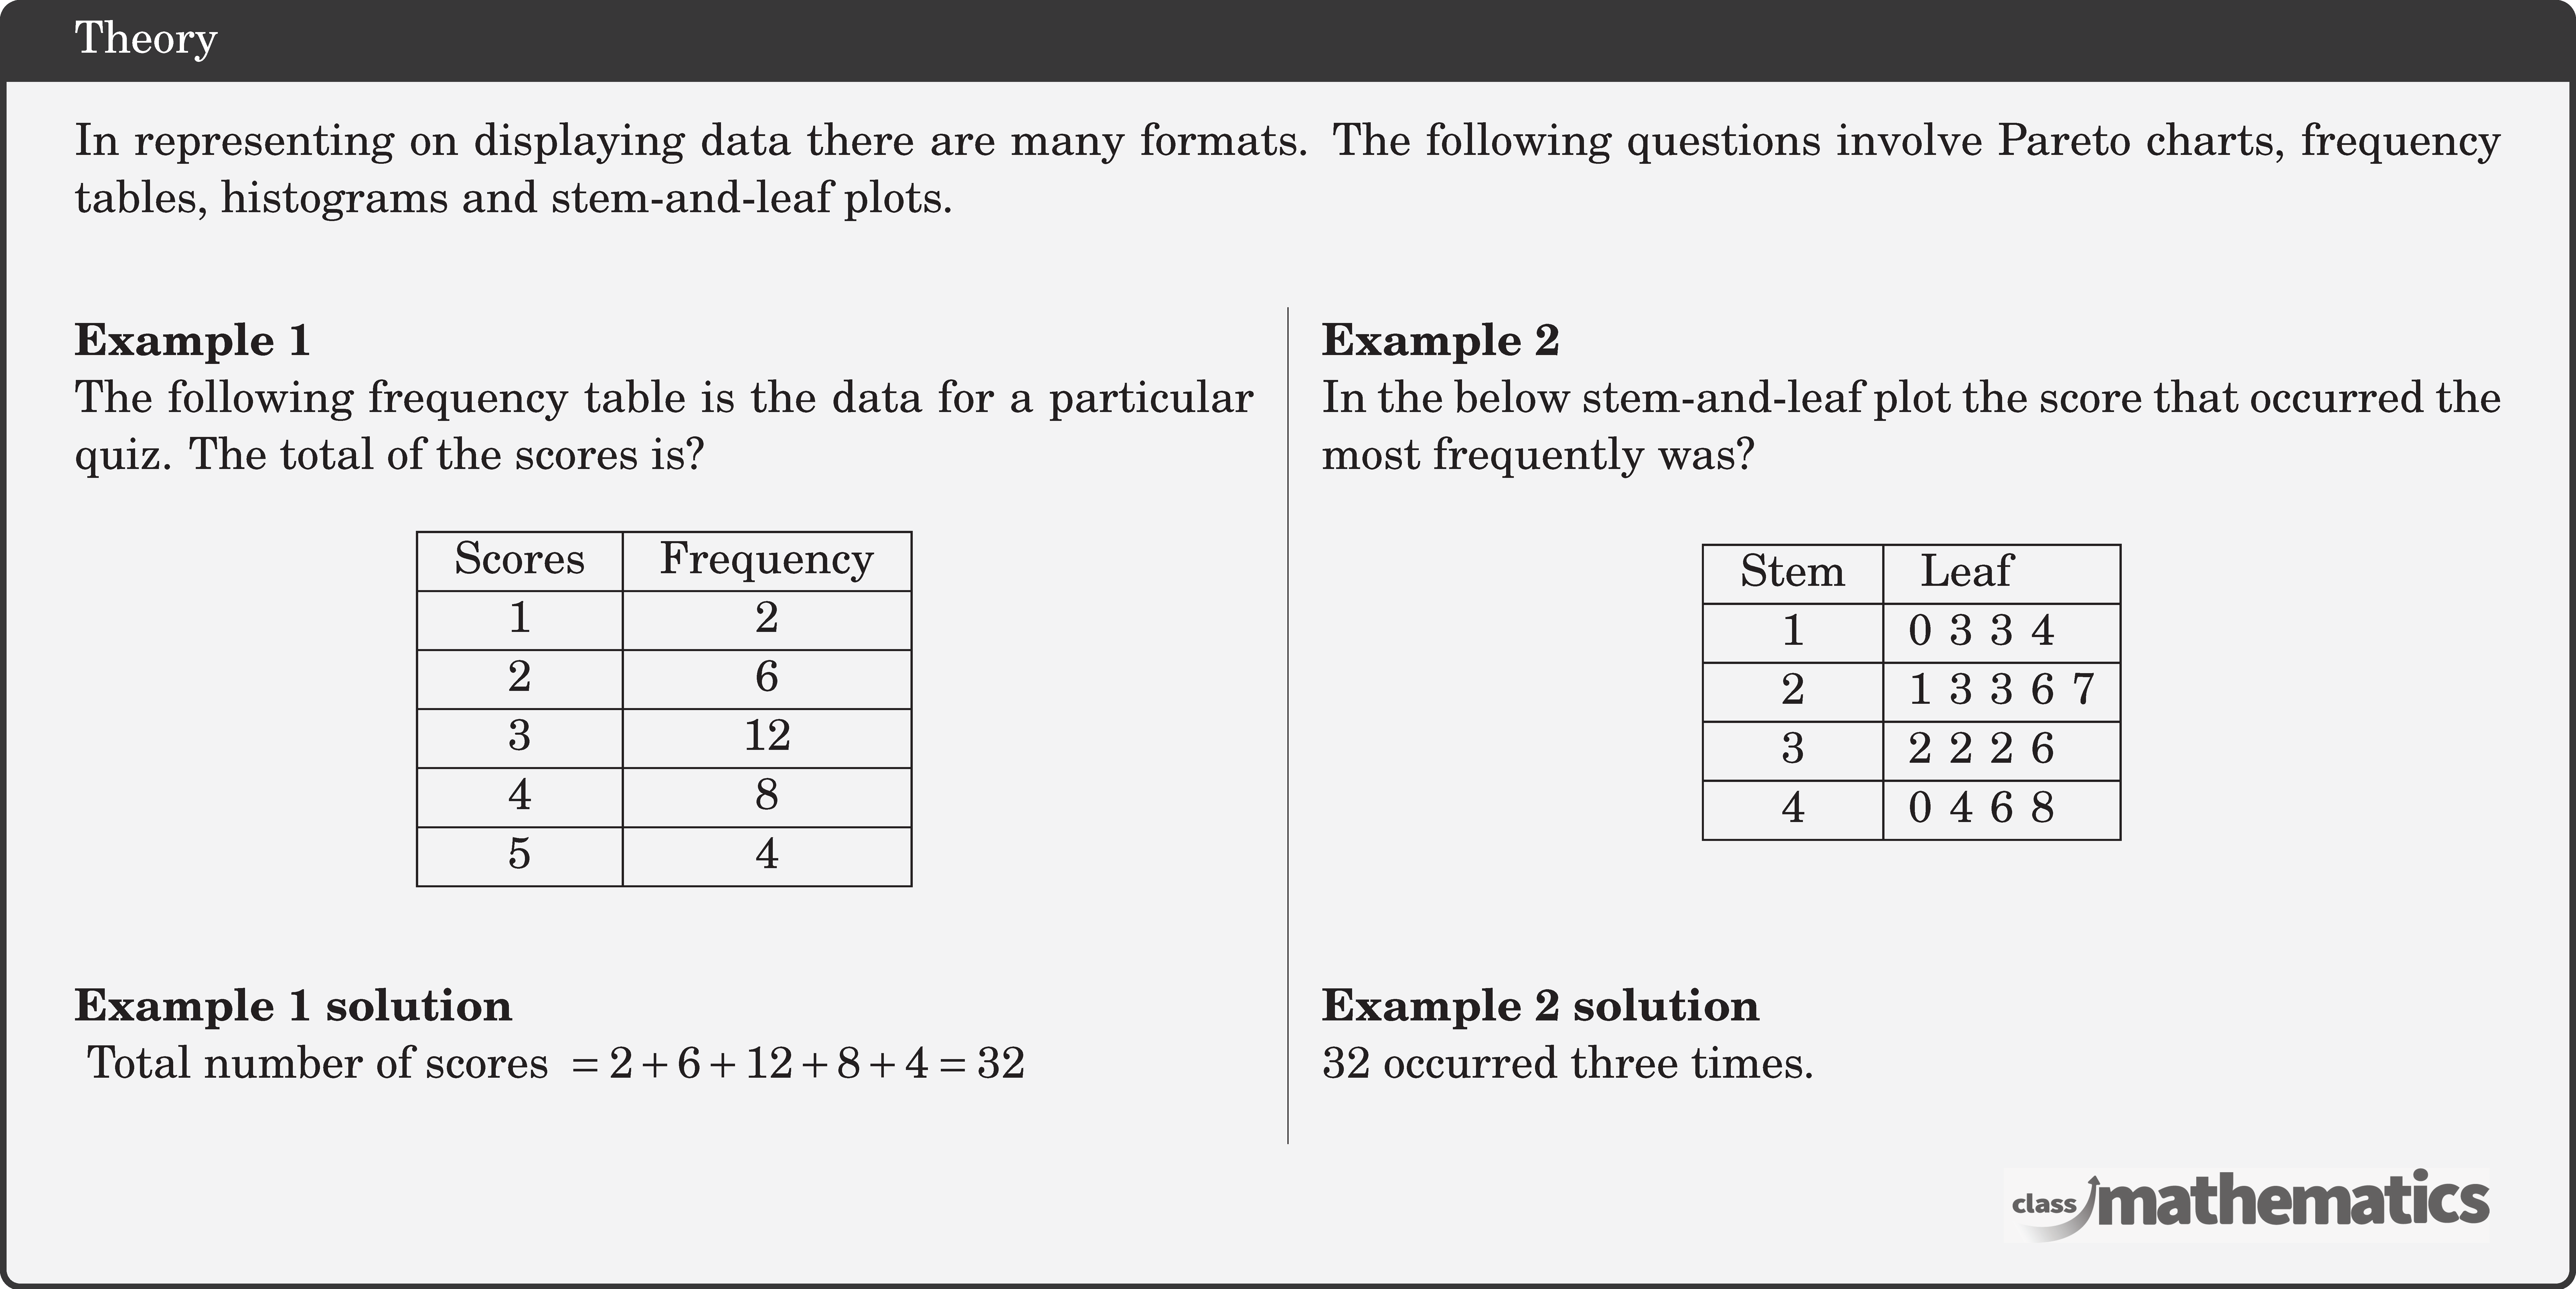
Displaying Data 1 Theory

