-
Previewing
Descriptive Statistics - Diagnostic Quiz 1
Question 1 of 24Which set of data is classified as numerical and continuous?
AThe number of soccer goals scored in a season
BThe amount of monthly rainfall
CThe most popular quiz show
DThe number of people that die of cancer each week
AnswerYou must be logged in to see the answer.You must be logged in to see the worked solutions. -
Previewing
Descriptive Statistics - Diagnostic Quiz 1
Question 2 of 24Which set of data is classified as categorical and nominal?
AThe genders of nurses in hospitals
BThe petrol consumption rate of makes of cars
CThe number of votes for parties in an election
DCustomers rating of a product in a scale from 1 to 5
AnswerYou must be logged in to see the answer.You must be logged in to see the worked solutions.You must have an active subscription to access course content
-
Previewing
Descriptive Statistics - Diagnostic Quiz 1
Question 3 of 24Which set of data is classified as categorical and ordinal?
AThe number of children in Australian families
BTypes of dogs owned by families
CCountries of origin of immigrants
DThe sizes of apples picked (small, medium, large)
AnswerYou must be logged in to see the answer.You must be logged in to see the worked solutions.You must have an active subscription to access course content
-
Previewing
Descriptive Statistics - Diagnostic Quiz 1
Question 4 of 24Which set of data is classified as numerical and discrete?
AThe weight of cattle at a show
BThe most popular radio stations
CThe time taken to finish a swimming race
DThe number of cats owned by students
AnswerYou must be logged in to see the answer.You must be logged in to see the worked solutions.You must have an active subscription to access course content
-
Previewing
Descriptive Statistics - Diagnostic Quiz 1
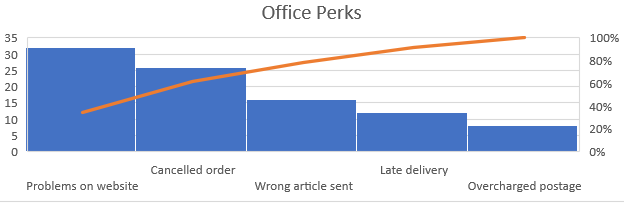
Question 5 of 24In the pareto chart above, which categories make up 80% of the complaints?
AProblems on website, cancelled order, wrong article sent
BProblems on website, cancelled order
COvercharged postage, problems on website
DWrong article sent, late delivery, overcharged postage
AnswerYou must be logged in to see the answer.You must be logged in to see the worked solutions.You must have an active subscription to access course content
-
Previewing
Descriptive Statistics - Diagnostic Quiz 1
-
Previewing
Descriptive Statistics - Diagnostic Quiz 1
-
Previewing
Descriptive Statistics - Diagnostic Quiz 1
Question 8 of 24In the adjacent two-way table the data is from a year of students who study French and German. How many Females study German?
AnswerYou must be logged in to see the answer.You must be logged in to see the worked solutions.You must have an active subscription to access course content
-
Previewing
Descriptive Statistics - Diagnostic Quiz 1
Question 9 of 24The above divided bar graph shows the percentage of votes gained by the indicated political parties in Australia. If the length of the bar is 24cm, what length should the ALP be?
AnswerYou must be logged in to see the answer.You must be logged in to see the worked solutions.You must have an active subscription to access course content
-
Previewing
Descriptive Statistics - Diagnostic Quiz 1
-
Previewing
Descriptive Statistics - Diagnostic Quiz 1
-
Previewing
Descriptive Statistics - Diagnostic Quiz 1
-
Previewing
Descriptive Statistics - Diagnostic Quiz 1
-
Previewing
Descriptive Statistics - Diagnostic Quiz 1
-
Previewing
Descriptive Statistics - Diagnostic Quiz 1
Question 15 of 24Given the 5 point summary \(10,12,13,14,18\) which statement is not true?
AIQR = 2
B10 is an outlier
C18 is an outlier
DThe median is 13
AnswerYou must be logged in to see the answer.You must be logged in to see the worked solutions.You must have an active subscription to access course content
-
Previewing
Descriptive Statistics - Diagnostic Quiz 1
Question 16 of 24From the data in the adjacent stem-and-leaf plot determine the median score
\begin{array}{|c|l|}
\hline
\text { Stem } & \text { Leaf } \\
\hline 1 & 1\,3\,5 \\
\hline 2 & 2\,4\,6 \\
\hline 3 & 1\,1\,2\,3 \\
\hline 4 & 2\,5\\
\hline
\end{array}AnswerYou must be logged in to see the answer.You must be logged in to see the worked solutions.You must have an active subscription to access course content
-
Previewing
Descriptive Statistics - Diagnostic Quiz 1
-
Previewing
Descriptive Statistics - Diagnostic Quiz 1
-
Previewing
Descriptive Statistics - Diagnostic Quiz 1
-
Previewing
Descriptive Statistics - Diagnostic Quiz 1
Question 20 of 24Given the scores: 7,15,15,16,16,16,17,17,18,19 determine the interquartile range and the sample standard deviation.
AnswerYou must be logged in to see the answer.You must be logged in to see the worked solutions.You must have an active subscription to access course content
-
Previewing
Descriptive Statistics - Diagnostic Quiz 1
Question 21 of 24Given the scores \(4, 10, 10, 11, 12, 13, 13, 14, 14, 15, 20\) determine the interquartile range and the sample standard deviation.
AnswerYou must be logged in to see the answer.You must be logged in to see the worked solutions.You must have an active subscription to access course content
-
Previewing
Descriptive Statistics - Diagnostic Quiz 1
Question 22 of 24Given the scores: 9, 10, 10, 10, 12, 12, 13, 14 if 18 is added to these scores then:
AThe median will increase and the standard deviation decrease
BThe median will decrease and the standard deviation decrease
CThe median will decrease and the standard deviation increase
DThe median will increase and the standard deviation increase
AnswerYou must be logged in to see the answer.You must be logged in to see the worked solutions.You must have an active subscription to access course content
-
Previewing
Descriptive Statistics - Diagnostic Quiz 1
-
Previewing
Descriptive Statistics - Diagnostic Quiz 1
Question 24 of 24Given the scores: \(2,8,8,9,9,9,10,10,11,18\). Determine the interquartile range and the sample standard deviation
AnswerYou must be logged in to see the answer.You must be logged in to see the worked solutions.You must have an active subscription to access course content