-
Previewing
Frequency And Cumulative Frequency Graphs - Revision Quiz 1
-
Previewing
Frequency And Cumulative Frequency Graphs - Revision Quiz 1
-
Previewing
Frequency And Cumulative Frequency Graphs - Revision Quiz 1
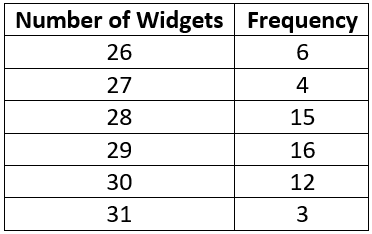
Question 3 of 7A packet of widgets is labelled contents \('30'\) but a quality control check found the results in the adjacent table.
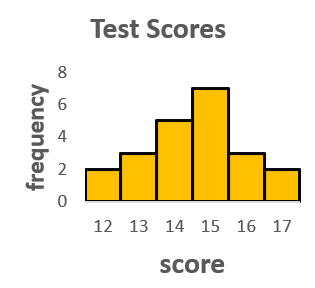
a) Using the graph, draw a frequency histogram from the data provided.
b) Determine the range.
 Answer
You must have an active subscription to access course content
-
Previewing
Frequency And Cumulative Frequency Graphs - Revision Quiz 1
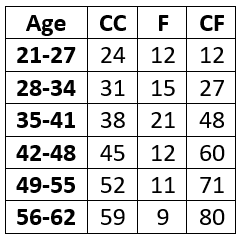
Question 4 of 7The adjacent table represents the number of patients coming into the emergency department in a hospital on a particular day.
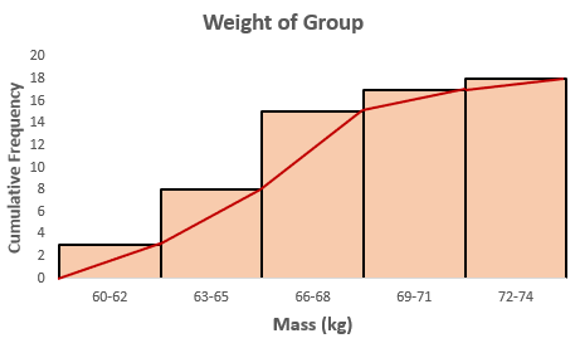
a) Draw a cumulative frequency histogram and on the same diagram an ogive.
b) Determine the median age.
 Answer
You must have an active subscription to access course content
-
Previewing
Frequency And Cumulative Frequency Graphs - Revision Quiz 1
-
Previewing
Frequency And Cumulative Frequency Graphs - Revision Quiz 1
-
Previewing
Frequency And Cumulative Frequency Graphs - Revision Quiz 1