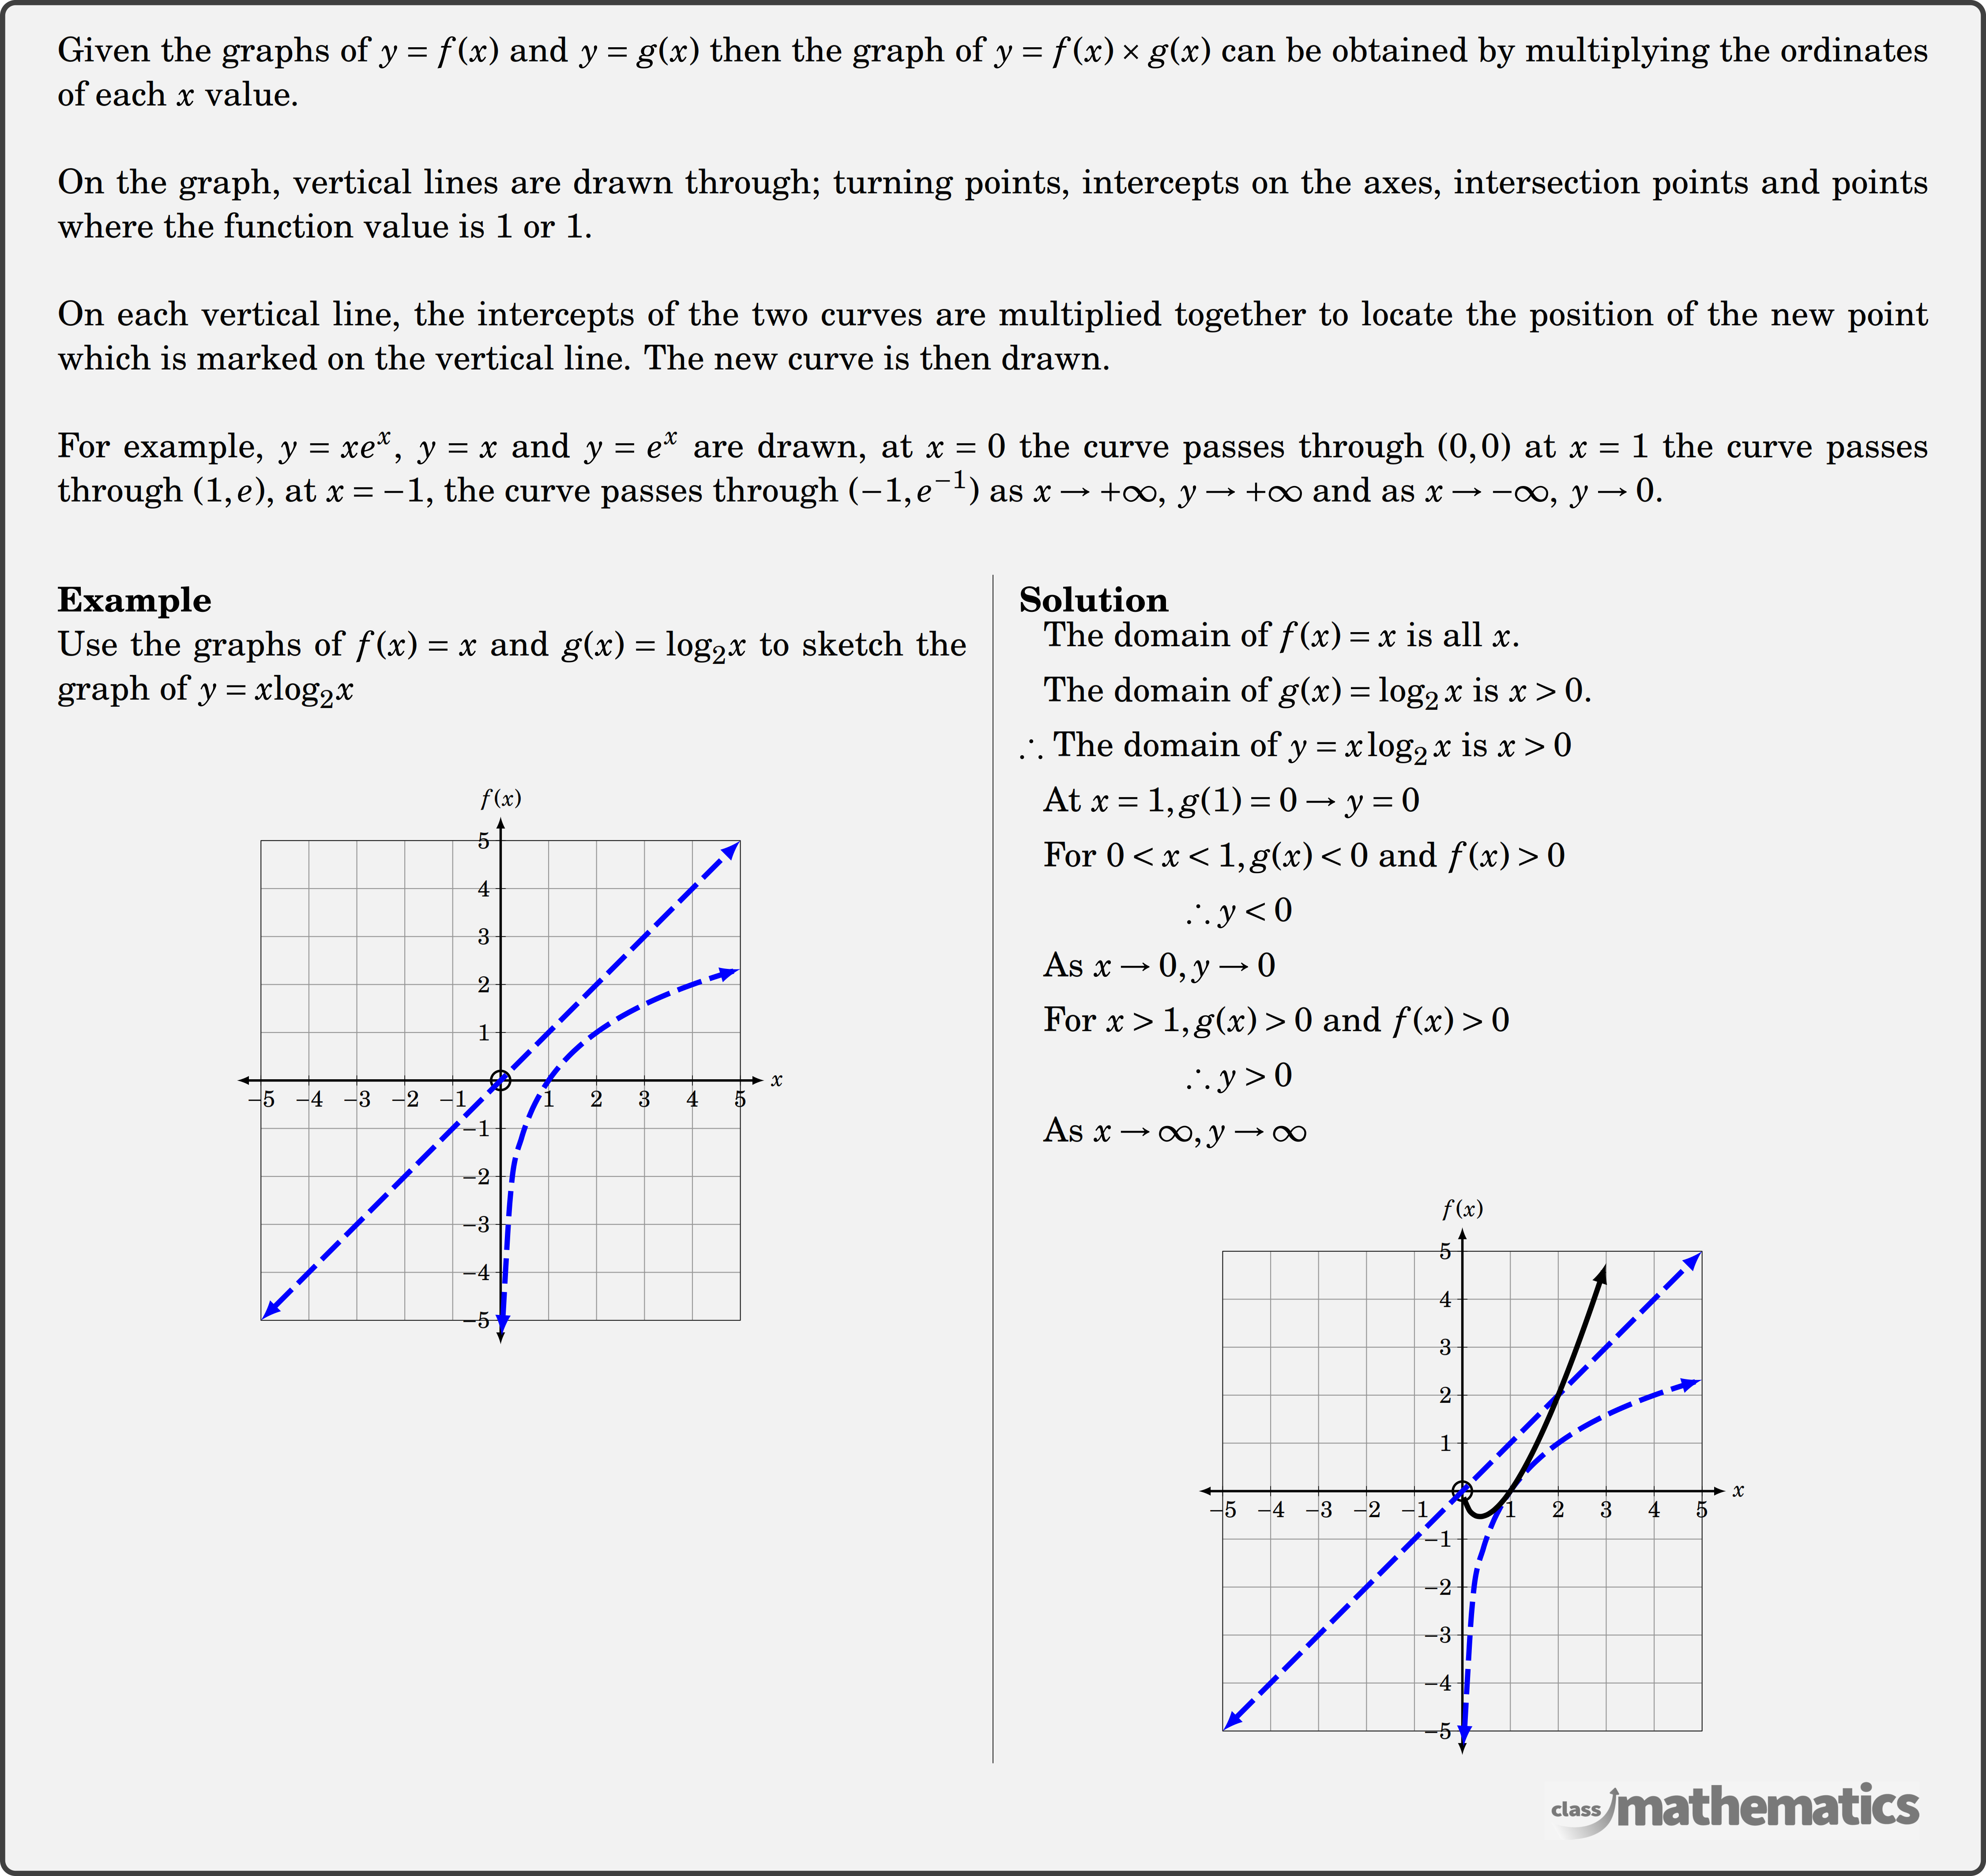
Given the graphs of \(y = f(x)\) and \(y = g(x)\) then the graph of \(y = f(x) \times g(x)\) can be obtained by multiplying the ordinates of each \(x\) value.
On the graph, vertical lines are drawn through; turning points, intercepts on the axes, intersection points and points where the function value is \(1\) or \(1\).
On each vertical line, the intercepts of the two curves are multiplied together to locate the position of the new point which is marked on the vertical line. The new curve is then drawn.
For example, \(y = x{e^x}\), \(y = x\) and \(y = {e^x}\) are drawn, at \(x = 0\) the curve passes through \((0,0)\) at \(x = 1\) the curve passes through \((1,e)\), at \(x = - 1\), the curve passes through \(( - 1,{e^{ - 1}})\) as \(x \to + \infty ,\,\,y \to + \infty \) and as \(x \to - \infty ,\,\,y \to 0\).

