-
Previewing
Comparing Data Sets - Revision Quiz 1
-
Previewing
Comparing Data Sets - Revision Quiz 1
Question 2 of 8The reaction times (in seconds) of a group of men and women were measured:
a) Find the median for men.
b) Describe the shape of female distribution. Are they positively skewed or negatively skewed
c) Which group has the greater spread of reaction times?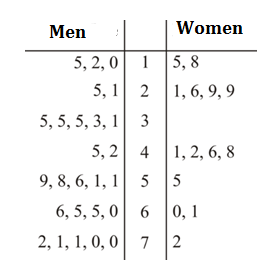 Answer
You must have an active subscription to access course content
-
Previewing
Comparing Data Sets - Revision Quiz 1
Question 3 of 8The dot plots show the temperatures (in deg C) at 4 p.m. for Brisbane and Perth for 16 days in autumn.
a) Which city’s temperatures is more skewed?
b) Find the median temperature for Brisbane.
c) Find the median temperature for Perth.
d) Find the range of temperature for Brisbane.
e) Find the range of temperature for Perth.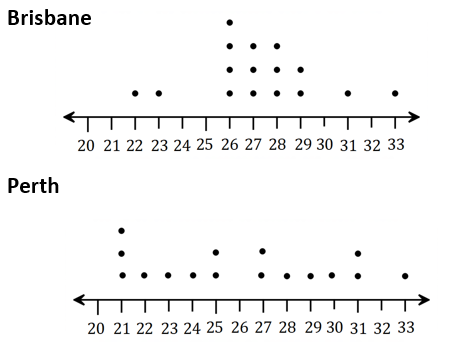 Answer
You must have an active subscription to access course content
-
Previewing
Comparing Data Sets - Revision Quiz 1
-
Previewing
Comparing Data Sets - Revision Quiz 1
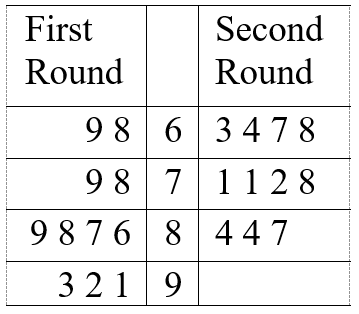
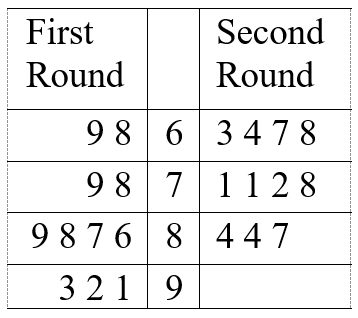
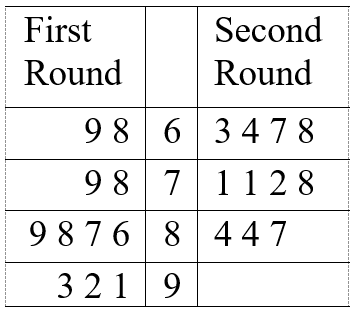
Question 5 of 8The scores obtained by \(11\) players in the first two rounds of a golf tournament are given in the back-to-back stem-and-leaf plot.
Find the difference in their standard deviations, correct to 1 decimal place.
 Answer
You must have an active subscription to access course content
-
Previewing
Comparing Data Sets - Revision Quiz 1
-
Previewing
Comparing Data Sets - Revision Quiz 1
-
Previewing
Comparing Data Sets - Revision Quiz 1