-
Previewing
Venn Diagrams - Revision Quiz 1
-
Previewing
Venn Diagrams - Revision Quiz 1
Question 2 of 4This Venn diagram shows people who like tea and coffee
a) Is tea and coffee mutually exclusive or not?
b) Find the total number of people represented in the diagram.
c) How many people like both tea and coffee?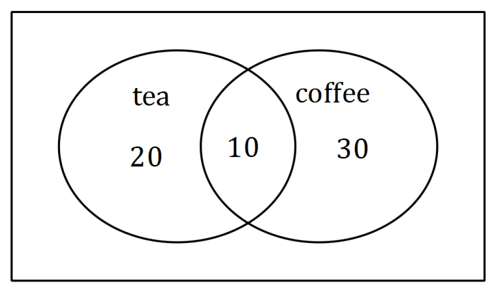 Answer
You must have an active subscription to access course content
-
Previewing
Venn Diagrams - Revision Quiz 1
Question 3 of 4A survey was carried out by an ice-cream shop to decide whether vanilla or chocolate was the favorite flavor.
i) How many people were surveyed?
ii) If a person is randomly chosen from the survey, what is the probability that the person likes both?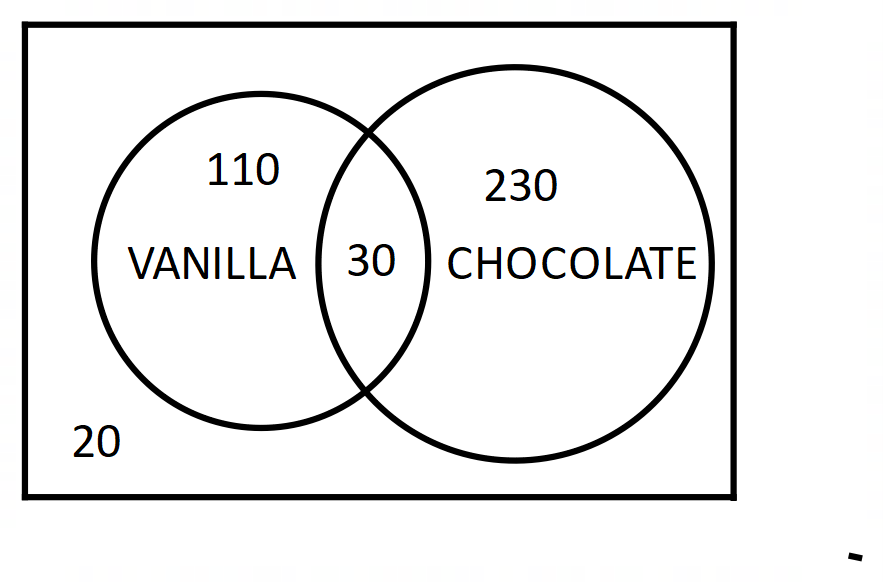 Answer
You must have an active subscription to access course content
-
Previewing
Venn Diagrams - Revision Quiz 1
Question 4 of 4This Venn diagram shows people who like tea and coffee. What is the decimal probability (correct to 1 decimal place) that a person randomly chosen from this group:
a) Likes tea?
b) Likes tea but not coffee?
c) Likes tea or coffee?
AnswerYou must have an active subscription to access course content