-
Previewing
Histograms and Stem-and-Leaf Plots - Revision Quiz 1
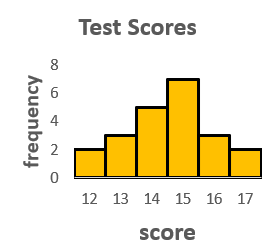
Question 1 of 8When 30 students ran 200m, their times (in seconds) were as follows where mean\(= 14.8\) and median\( = 14.95\)
a) Are there any outliers?
b) Are there any clusters between 14 – 15 seconds?
c) How many students ran the 200 m in less than 14 seconds?
d) What percentage of students took more than 15 seconds to run the 200 m?
e) What percentage (correct to one decimal place) of students ran times that were below the mean
f) What percentage (correct to one decimal place) of students ran times that were below the median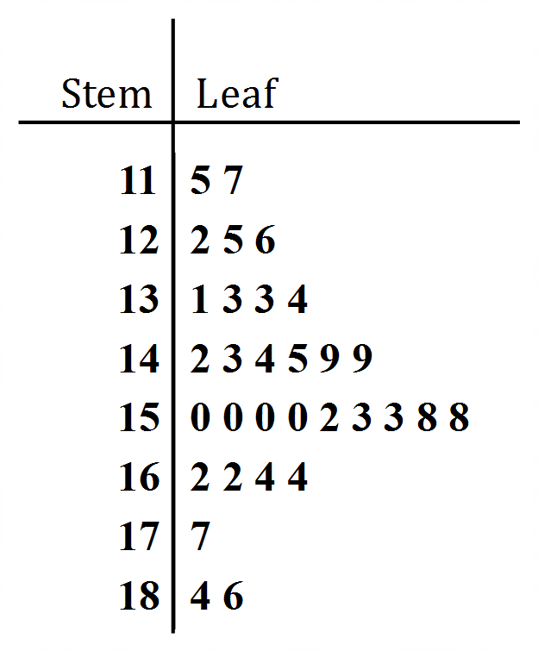 Answer
 -
Previewing
Histograms and Stem-and-Leaf Plots - Revision Quiz 1
Question 2 of 8This back-to-back stem-and-leaf plot shows the weight, in kg, of boys and girls in an Year 10 class

a) Which is the only weight that was found to be same for one of the boys and one of the girls?
b) Are the number of boys less than, equal to or greater than the number of girls?
c) What is the outlier weight for the girls?
d) Which set of weights has the greater range?
e) What is the difference between the maximum weight of a boy and minimum weight of a girl?
f) What is the difference between the average weight of boys and girls, correct to one decimal?AnswerYou must have an active subscription to access course content
-
Previewing
Histograms and Stem-and-Leaf Plots - Revision Quiz 1
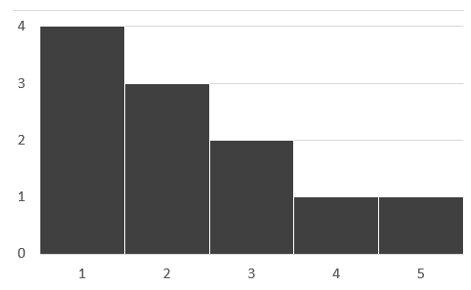
Question 4 of 8This histogram shows the number of children in a sample of families.

a) How many families were surveyed?
b) What percentage of families, to the nearest integer, consist only of adults?
c) Find the mode.
d) Find the range.
e) Find the median.
f) Find the mean, correct to 2 decimal placesAnswerYou must have an active subscription to access course content
-
Previewing
Histograms and Stem-and-Leaf Plots - Revision Quiz 1
-
Previewing
Histograms and Stem-and-Leaf Plots - Revision Quiz 1