-
Previewing
Venn Diagrams and Two-Way Tables - Revision Quiz 1
Question 1 of 8A group of people were asked whether they liked rugby or football at school. The Venn diagram shows the results of this survey. How many people:
a) were surveyed?
b) liked rugby but not football?
c) liked rugby or football?AnswerYou must be logged in to see the answer.You must be logged in to see the worked solutions. -
Previewing
Venn Diagrams and Two-Way Tables - Revision Quiz 1
Question 2 of 8This Venn diagram shows people who like tea and coffee
a) Is tea and coffee mutually exclusive or not?
b) Find the total number of people represented in the diagram.
c) How many people like both tea and coffee?
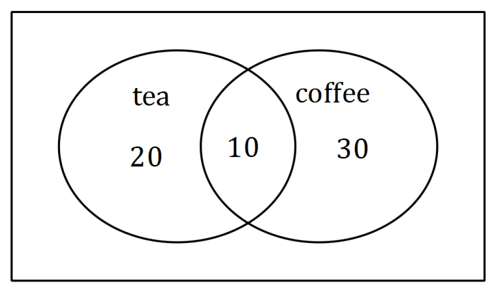
AnswerYou must be logged in to see the answer.You must be logged in to see the worked solutions.You must have an active subscription to access course content
-
Previewing
Venn Diagrams and Two-Way Tables - Revision Quiz 1
Question 3 of 8The given table shows the results of liking and disliking of apples from a group of children.
\begin{array}{|l|c|c|}
\hline & \text { Likes Apples } & \text { Dislikes Apples } \\
\hline \text { Boys } & 56 & 50 \\
\hline \text { Girls } & 64 & 55 \\
\hline
\end{array}If a child is randomly selected, find the probability to pick a boy who does not like apples?
AnswerYou must be logged in to see the answer.You must be logged in to see the worked solutions.You must have an active subscription to access course content
-
Previewing
Venn Diagrams and Two-Way Tables - Revision Quiz 1
Question 4 of 8A class in a college was surveyed on whether its students could sing. The results are shown.
\begin{array}{|l|c|c|}
\hline & \text { Can sing } & \text { Cannot sing } \\
\hline \text { Boys } & 25 & 5 \\
\hline \text { Girls } & 16 & 6 \\
\hline
\end{array}a) What is the probability that a student randomly selected from this class is a girl?
What is the probability that a student selected at random is:
b) a non-singer?
c) a girl who can sing?AnswerYou must be logged in to see the answer.You must be logged in to see the worked solutions.You must have an active subscription to access course content
-
Previewing
Venn Diagrams and Two-Way Tables - Revision Quiz 1
Question 5 of 8Lucas asked 170 students which juice they like to drink from orange, mango and pineapple juices. The results are shown in the Venn diagram.
a. How many students like to drink pineapple juice only?
b. Find the probability of selecting a student who prefers exactly two juices.
c. What is the probability of a student taking at least 2 juices?
d. Find the probability of selecting a student who prefers to take only one juice
e. Find the probability of selecting a student who prefers to take orange or mango juice but not pineapple juice
f. Find the probability of selecting a student who prefers to take at most 2 juices
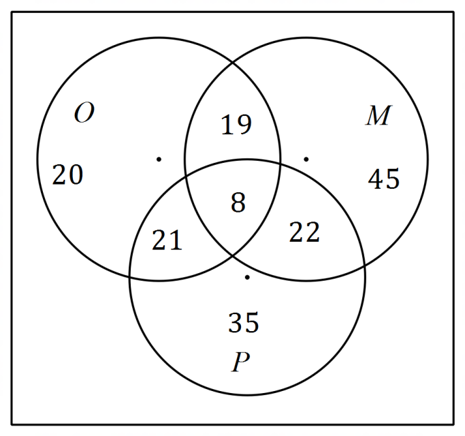
AnswerYou must be logged in to see the answer.You must be logged in to see the worked solutions.You must have an active subscription to access course content
-
Previewing
Venn Diagrams and Two-Way Tables - Revision Quiz 1
Question 6 of 8A group of students were asked about their interests in English and Maths.
a) How many students were asked?
b) Find the probability of selecting a student who has interest in both English and Maths
c) Find the probability of selecting a student who has interest in English or Maths but not both
d) Find the probability of selecting a student who has interest neither in English nor in Maths
e) What is the percentage probability of selecting a student who did not have interest in both English and Maths correct to one decimal place?
f) What is the percentage probability of the students who had interest in Maths?
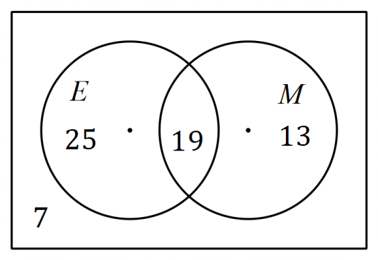
AnswerYou must be logged in to see the answer.You must be logged in to see the worked solutions.You must have an active subscription to access course content
-
Previewing
Venn Diagrams and Two-Way Tables - Revision Quiz 1
Question 7 of 8A primary school class was surveyed on whether its students could swim. The results are shown below.
\begin{array}{|c|c|c|}
\hline & \text { Can swim } & \text { Cannot swim } \\
\hline \text { Boys } & 24 & 5 \\
\hline \text { Girls } & 16 & 3 \\
\hline
\end{array}a. How many students are in the class?
b. How many students are boys and cannot swim?
c. How many students are boys or cannot swim?
d. What is the probability that a student randomly selected from this class is a girl?
e. What is the probability that a student selected at random is a non-swimmer?
f. What is the probability that a student selected at random is a girl who can swim?AnswerYou must be logged in to see the answer.You must be logged in to see the worked solutions.You must have an active subscription to access course content
-
Previewing
Venn Diagrams and Two-Way Tables - Revision Quiz 1
Question 8 of 8A survey was done on men and women to determine if they were diabetic or non-diabetic.
\[\begin{array}{ | c | c | c | }
\hline & \text{Diabetic} & \text{Non-Diabetic} \\
\hline \text{Men} & 80& 70 \\
\hline \text{Women} & 64& 106\\
\hline \end{array}\]a. How many men and women were surveyed?
b. What is the probability of selecting a person at random who is diabetic?
c. What percentage of people are diabetic correct to one decimal place?
d. What is the probability of selecting a person at random who are non-diabetic?
e. Of the women who were surveyed, what percentage are non-diabetic correct to 2 decimal places?
f. If a person is randomly selected from this survey, what is the probability that he is a diabetic man?AnswerYou must be logged in to see the answer.You must be logged in to see the worked solutions.You must have an active subscription to access course content